NZD/USD Analysis:
- Monetary policy conundrum adds to uncertainty ahead of September RBNZ meeting
- NZD/USD rejected at key weekly level around 0.6785
- Signs of NZDUSD exhaustion: MACD, RSI and bearish engulfing
- IG Client Sentiment: Recent longs invalidate the typical contrarian view to sentiment
NZD/USD Faces Headwinds as RBNZ Considers More Unconventional Tools
The Kiwi dollar surrendered some of its recent gains versus the greenback as the USD has started to strengthen against its peers, coming off a downward spiral experienced throughout most of Q3.
In the August policy assessment, the RBNZ expanded the Large Scale Asset Purchase (LSAP) programme up to NZ$100 billion to lower retail interest rates in order to achieve its remit. Additionally, the Monetary Policy Committee (MPC) agreed that, “a package of additional monetary instruments must remain in active preparation”, communicating that the deployment of such instruments will depend on the outlook for inflation and employment.
The MPC clarified that these instruments include the possibility of a negative Official Cash Rate (OCR) while offering funding to retail banks to spur lending activity.
Why are central bank announcements so important? Find out how central banks impact the forex market
DailyFX Central Bank Calendar
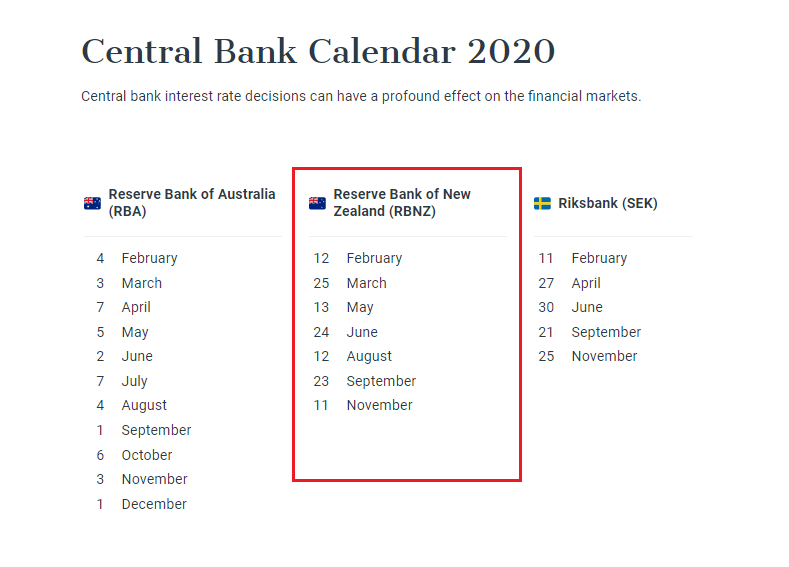
For all major central bank meetings and events see the DailyFX Central Bank Calendar
NZD/USD Reverses off Key Weekly Zone of Support
NZD/USD has turned sharply lower since approaching the significant weekly zone of resistance at around 0.6785 (highlighted in blue). The level is significant because price has approached the level previously and, so far, has failed to break above.
NZD/USD Weekly Chart: Reversal off Key Resistance Zone
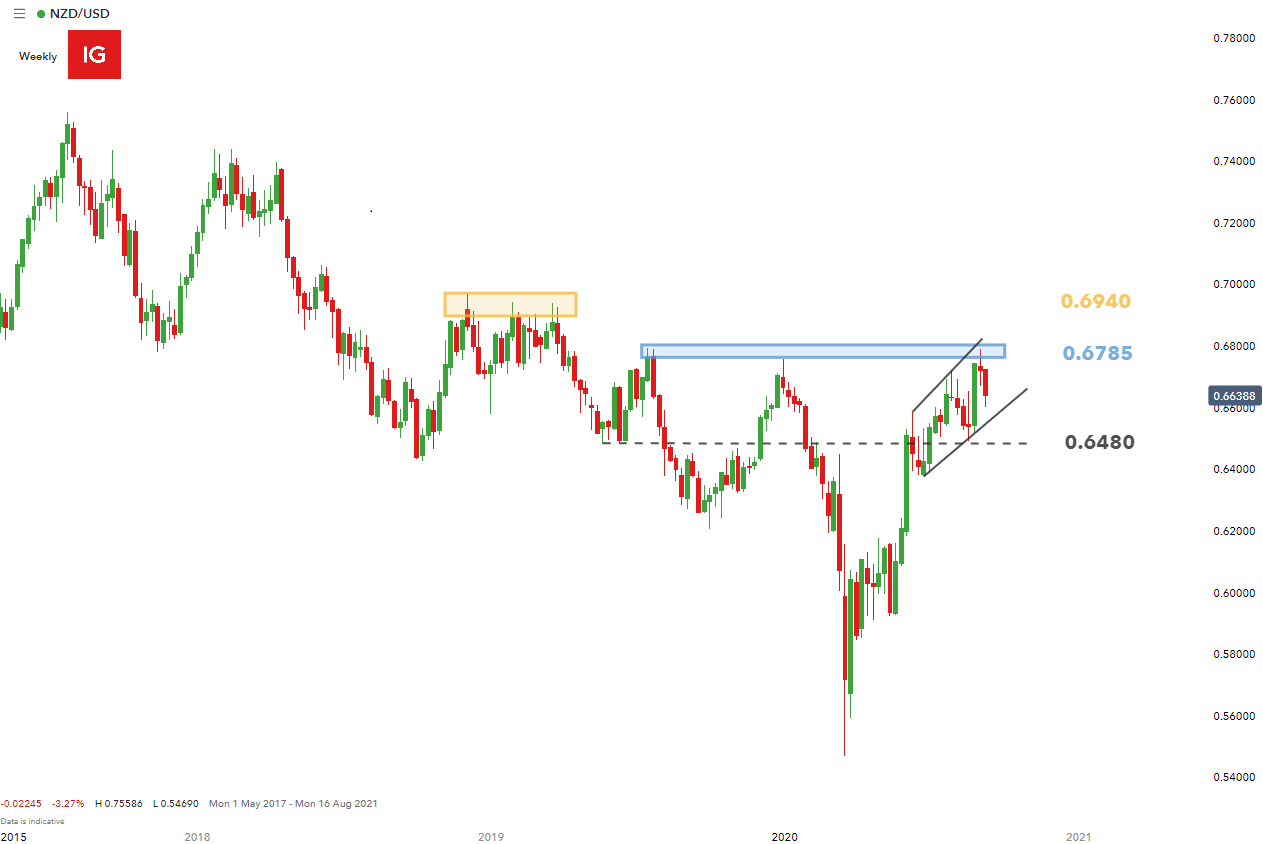
Chart prepared by Richard Snow, IG
Signs of NZDUSD exhaustion: MACD, RSI and bearish engulfing
The daily chart provides more granular detail into the recent move lower. Price approached the area of confluence (key weekly level of 0.6785 and trendline resistance) before forming a strong bearish engulfing pattern (black rectangle).
Learn how to identify and apply the bearish engulfing pattern to price charts
A continued move lower should not be discounted as evidenced by the negative divergence on the Relative Strength Indicator (RSI). Prices made higher highs while the RSI printed lower highs, opening the door to a possible bearish move. In addition, the bearish MACD crossover may also support a bearish narrative. Near term support comes in at 0.6585, then 0.6480 before the 0.6373 level.
However, a strong move off the 0.6585 may indicate that bullish trend has not run its course just yet. Resistance remains at the key weekly level of 0.6785 with the next area of resistance almost 200 pips away at 0.6940.
NZD/USD Daily Chart: Bearish Engulfing, MACD Crossover and Negative Divergence
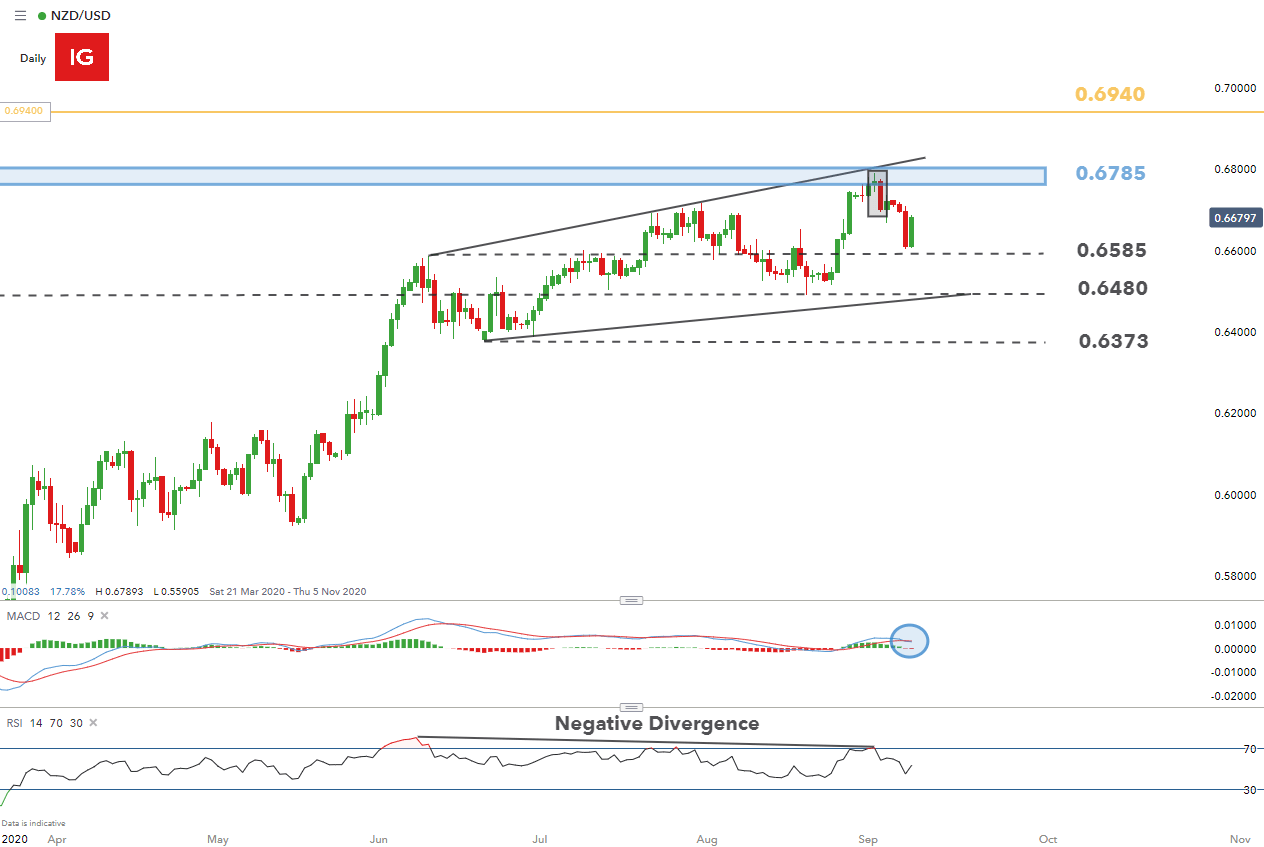
Chart prepared by Richard Snow, IG
DailyFX is hosting its very first virtual trading expo and day 3 covers the FX market. See below for details:
Starts in:
Live now:
Sep 17
( 16:09 GMT )

Join Day 3 of the DailyFX Summit discussing currencies
DailyFX Education Summit: Trade Your Market – Day 3, Forex
NZD/USD IG Client Sentiment Mixed but Hints at a Possible Move Lower
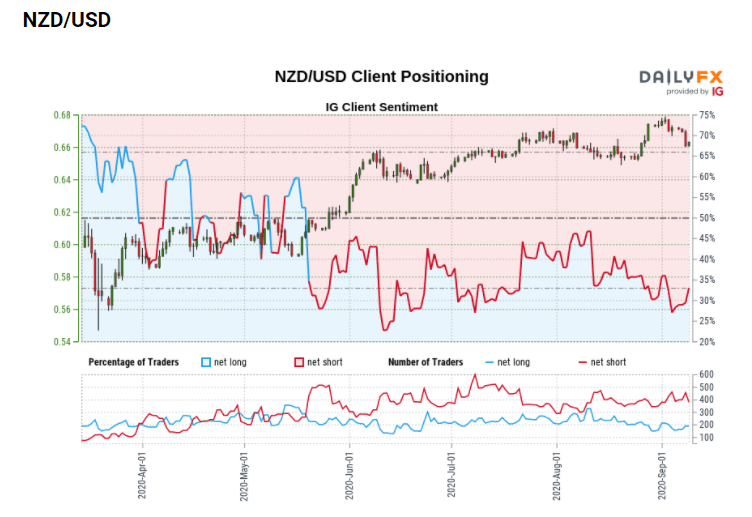
- NZD/USD retail trader data shows 39.15% of traders are net-long with the ratio of traders short to long at 1.55 to 1.
- We typically take a contrarian view to crowd sentiment, and the fact traders are net-short suggests NZD/USD prices may continue to rise.

Recommended by Richard Snow
Find out how to analyze client sentiment
- The number of traders net-long is 26.23% higher than yesterday and 3.59% higher from last week, while the number of traders net-short is 23.13% lower than yesterday and 11.58% lower from last week.
- Recent changes in sentiment warn that the current NZD/USD price trend may soon reverse lower despite the fact traders remain net-short.
| Change in | Longs | Shorts | OI |
| Daily | 9% | -7% | -2% |
| Weekly | 0% | -15% | -10% |
— Written by Richard Snow for DailyFX.com
Contact and follow Richard on Twitter: @RichardSnowFX