“I will go to my grave… believing that really loose monetary policy greatly contributed to the Financial Crisis. There were obviously problems with regulation, but when we had a 1% Fed Funds rate in 2003 after, to me, it was pretty obvious that the economy had turned (up) and I think the economy was growing at 7% to 9% nominal in the fourth quarter of 2003 and that wasn’t enough for the Fed. They had this little thing called ‘considerable period’ on top of the 1% rate just so we would make sure that their meaning was clear. And it was all wrapped around this concept of an insurance cut… I’ve made some money predicting boom-bust cycles. It’s what I do. Sometimes I am right. Sometimes I am wrong, but every bust I had ever seen was proceeded by an asset bubble generally set up by too loose policy…” – Stanley Druckenmiller
Introduction
The year 2020 is going to be written about in history books for a number of reasons, however, a quiet footnote, at least right now, is going to show that in the financial markets, this year marked the beginning of a historic capital rotation.
Skeptical?
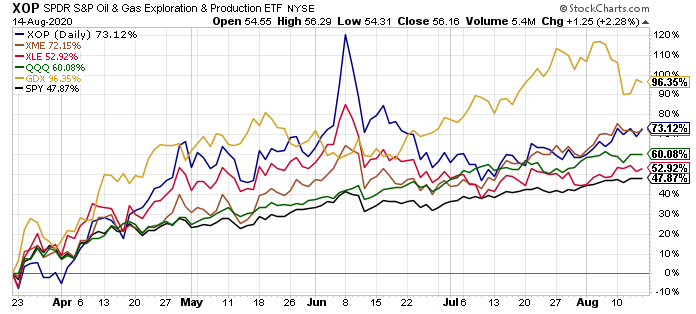
Since the broader market March 23rd, 2020 lows in the SPDR S&P 500 ETF (SPY), economically sensitive and inflation-sensitive assets are outperforming.
 (Source: Author, StockCharts.com)
The VanEck Vectors Gold Miners ETF (GDX) is up 96.4% over this time frame, and may be boosted further after Buffett’s recently disclosed investment stake in Barrick Gold (GOLD), which I wrote about recently, the SPDR S&P Oil & Gas Exploration & Production ETF (XOP) is higher by 73.1%, the SPDR S&P Metals & Mining ETF (XME) is higher by 72.2%, and the Energy Select Sector SPDR Fund (XLE) is higher by 52.9%. All of these sector ETFs have outperformed the SPDR S&P 500 ETF, which has risen 47.9%, and three of the four have outperformed even the red-hot Invesco QQQ Trust (QQQ), which has risen 60.1% from the March 23rd lows, as the performance chart above illustrates.
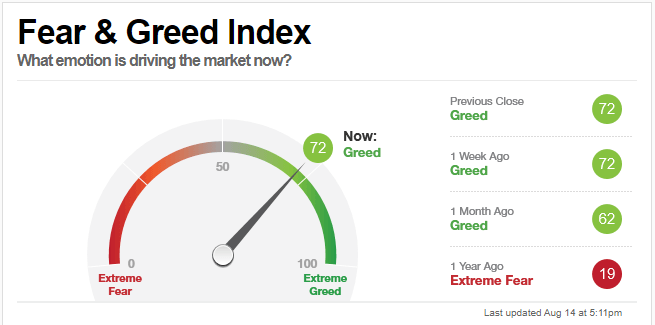
The quiet relative outperformance of economically sensitive and inflation-sensitive assets is happening, as investor enthusiasm has drifted firmly into greed territory, as evidenced by CNN’s Fear & Greed Index, which is shown below.
 (Source: CNN)
The Fear & Greed Index referenced above, actually understates how ebullient investors have become, which I think can be more accurately shown in the Citigroup (NYSE:C) Panic/Euphoria model.
 (Source: Citigroup)
Building on this narrative, ebullient sentiment is clearly present in the commentary section of my recent Apple (AAPL) public article, where I turned cautious on Apple shares, writing with the title, “Apple: Most Expensive Valuation In A Decade” that AAPL shares were prohibitively expensive,, which had the opposite title of an article I published over four years ago, on May 13th, 2016, which was, “Apple: Cheapest Valuation In A Decade.”
In summary, the investing public at large is chasing historically overvalued and over-owned stocks higher, while ignoring the relative outperformance of historically undervalued and under-owned equities, setting the stage for a reversal of fund flows that could cause a sharp broader market correction and eventually accelerate the historic burgeoning capital rotation.
Starting Valuations For Stocks and Bonds Are Very Poor
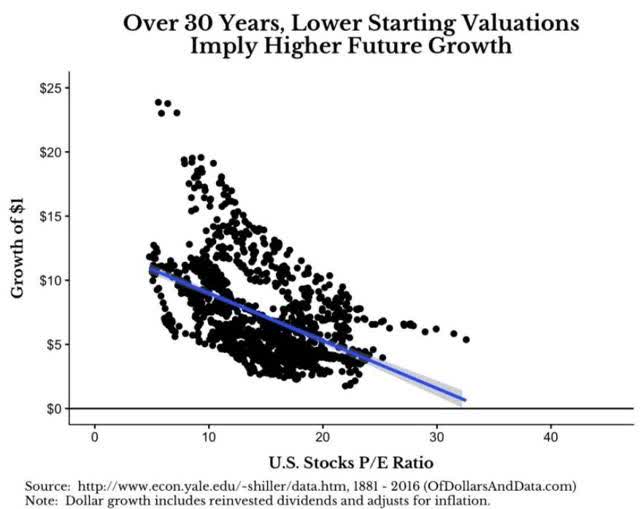
Starting valuations are incredibly important for future returns, as this graphic from Robert Schiller at Yale illustrates below.
 (Source: Robert Shiller, Yale)
So where do we stand with regard to starting valuations today?
 (Source)
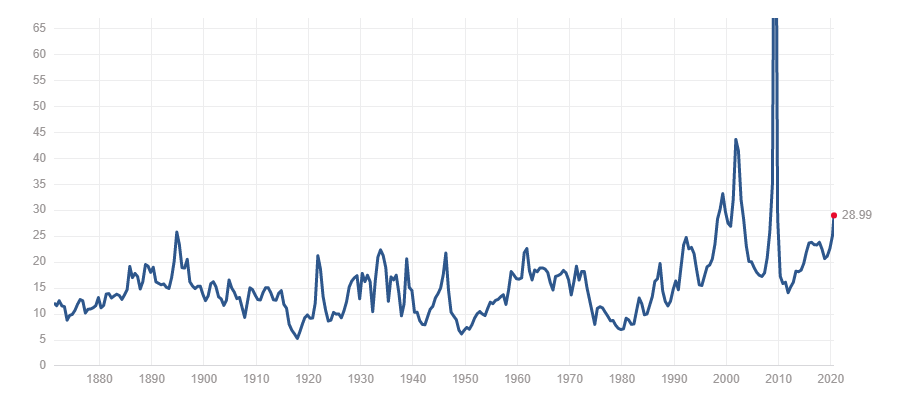
How about a price-to-earnings ratio of near 29, which is climbing the latter of historical multiples, as the chart above shows.
Many investors may think that price-to-earnings ratios are elevated simply because earnings are temporarily discounted because of the fallout from COVID-19. That is not the case, however, as forward price-to-earnings ratios are elevated too.
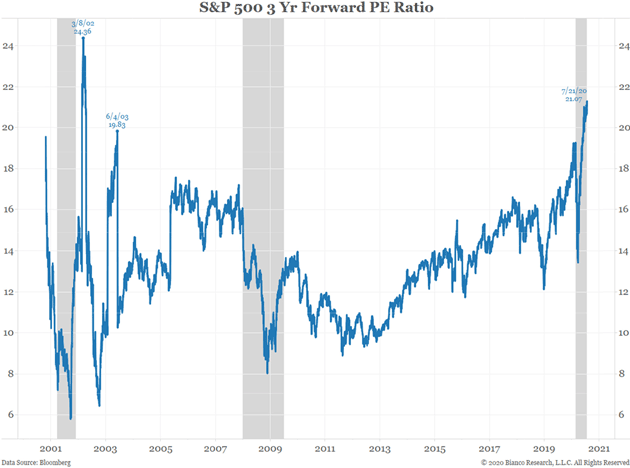 (Source: Bianco Research, Bloomberg)
Adding to the narrative, earnings are not keeping pace with rising stock prices, which means the performance gains in the headline stock indices, like the S&P 500 Index (SP500) and the Dow Jones Industrial Average (DIA) are being driven by multiple expansion.
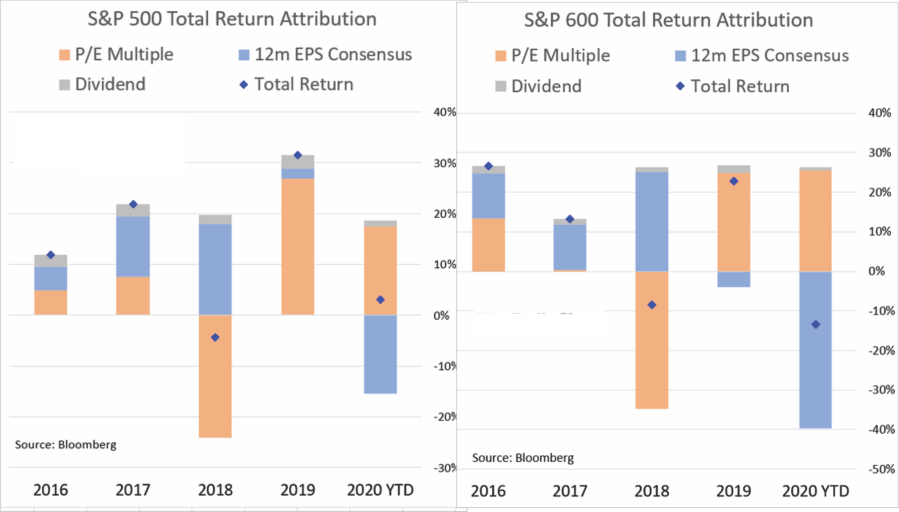 (Source: Bloomberg)
Ultimately, price-to-earnings ratios cannot expand forever, even in a historically low interest rate environment, which ironically implies that future growth is going to be less than expectations.
The Biggest Market Capitalization Stocks Are The Worst Offenders
The top ten positions in the SPDR S&P 500 Index ETF are listed as follows, with their ETF weighting, and their respective price-to-earnings ratios
- Microsoft (MSFT), 6.0% weighting, 36.3 price-to-earnings ratio
- Apple Inc. 5.8% weighting, 34.9 price-to-earnings ratio
- Amazon (AMZN) 4.5% weighting, 120.9 price-to-earnings ratio
- Alphabet (GOOGL), (GOOG), 3.2% weighting, 33.1 price-to-earnings ratio
- Facebook (FB), 2.1% weighting, 31.9 price-to-earnings ratio
- Johnson & Johnson (JNJ), 1.4% weighting, 26.1 price-to-earnings ratio
- Berkshire Hathaway Class B (BRK.B) 1.4% weighting, 23.1 price-to-earnings ratio
- Visa (V), 1.3% weighting, 37.4 price-to-earnings ratio
- Procter & Gamble (PG), 1.2% weighting, 27.2 price-to-earnings ratio
- Johnson & Johnson (JNJ), 1.2% weighting, 26.1 price-to-earnings ratio
Collectively, these equities combine to compromise roughly 28% of the SPDR S&P 500 ETF, and their average price-to-earnings ratio is 39.7, skewed higher by AMZN’s outlier price-to-earnings ratio, which is significantly above the 29 price-to-earnings multiple for the broader market shown earlier. If you remove AMZN’s elevated P/E ratio from the average, the remaining nine largest market capitalization firms’ average price-to-earnings ratio falls to 30.7, still above the historically elevated broader S&P 500 Index P/E ratio of 29.
Procter & Gamble shares, which I wrote about earlier in the fall of 2019, might be the most egregiously overpriced, considering their underlying revenue growth.
Wrapping up this section, the market is top-heavy, though not as much as the late 1990s, yet the more important takeaway is that starting valuations are going to lead to poor future real returns.
Poor Starting Valuations Are Going To Lead To Poor Future Real Returns
The past decade has delivered extraordinary returns for both stock and bond investors. These recent returns have cemented the notion that a traditional 60/40 stock and bond portfolio is the ideal place to park savings, especially when short-term interest rates, and long-term interest rates, for that matter remain anchored near the zero-bound range.
As a market historian, and a contrarian investor at heart, I take the opposite view, and I think a traditional 60/40 portfolio is destined to fail today.
Building on this narrative, investors need to remember that anytime the investment industry posts returns, the disclaimer that past returns are no guarantee of future performance is often used, and that is more applicable today than ever, as indicators of future real returns are as low as I have ever seen, which makes sense again, given the current starting valuations.
Building on this narrative, noted value-oriented investment firm Grantham, Mayo, Van Otterloo & Co. LLC expects real returns, on an annual basis, to be substantially negative for U.S. stocks and U.S. bonds going forward over the next seven years.
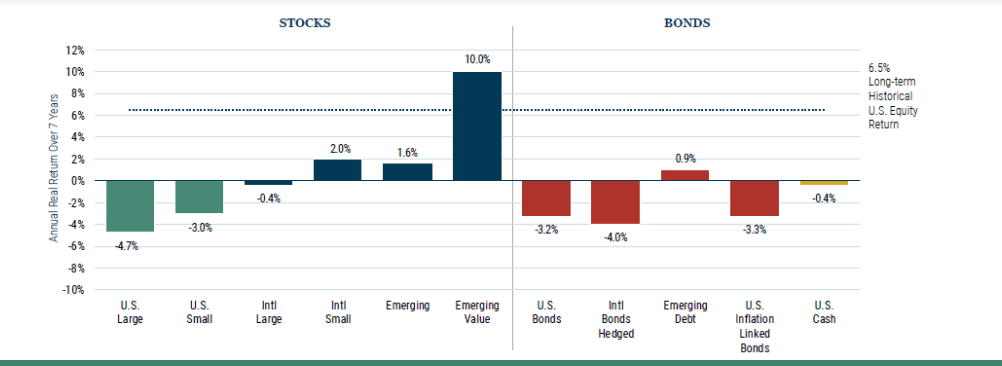 (Source: GMO)
Think about what the table above suggests for real returns for a minute, and what it means if GMO’s forecast is anywhere near accurate.
Digging deeper, as the table shows, the long-term historical U.S. Equity real return is 6.5%. Keep in mind that this is real terms, so nominal historical returns would be higher with the inflationary component. However, the important point is that a negative 4.7% real return for U.S. large-cap stocks annually, combined with an expected negative 3.2% real return for U.S. bonds annually, would torpedo the investment plans of many investors today.
Closing Thoughts – Prepare For A Sell-Off and Enhance Future Real Returns By Diversifying Into Commodity Equities
The broader stock market appears to be following the path of a classic bubble, which I outlined in this article previously, and used this chart to illustrate.
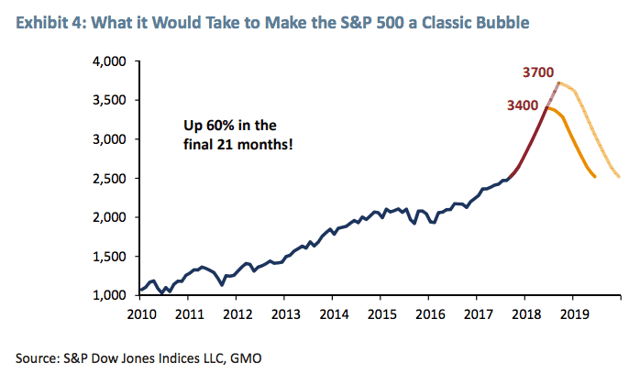 (Source: GMO)
Where we top, we will only know with the benefit of hindsight, however, we are already in a euphoric market environment, where the S&P 500 Index is scraping against the ceiling of even projected bubble levels.
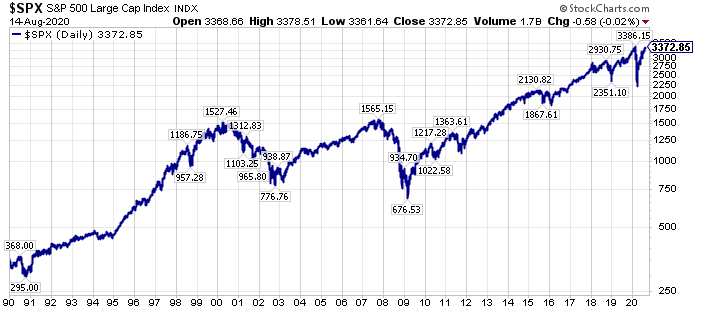 (Source: Author, StockCharts.com)
The euphoria is even stronger in favored growth stocks like Tesla (TSLA), Nvidia (NVDA), and Netflix (NFLX), which trade at trailing twelve-month price-to-earnings ratios of 854.4, 86.5, and 81.5, respectively.
Growth stocks now dominate the largest companies in the S&P 500 Index, and these top-ten companies trade with a much higher price-to-earnings ratio, at 39.7, skewed higher by Amazon’s elevated price-to-earnings ratio, that the broader S&P 500 Index, which still trades at a historically high price-to-earnings ratio of 29.
Now, I know that elevated valuations have not mattered for years, however, with record-low long-term interest rates, the bond market is implying weaker growth, which would ultimately force valuation multiples down if it occurs. Alternatively, if the stock market and commodities market are correct, and economic growth turns higher, then longer-term bond yields are going to go higher, hurting duration and yield-oriented assets. On this note, the longest duration assets in the stock market are the large capitalization growth equities. For investors, it is a lose/lose proposition, all because starting valuations are so high on a historical basis.
Where can an investor turn, particularly a longer-term investor?
Fortunately, there is one asset class, commodities, that is historically out-of-favor. And that asset class is loathed today on a relative basis.
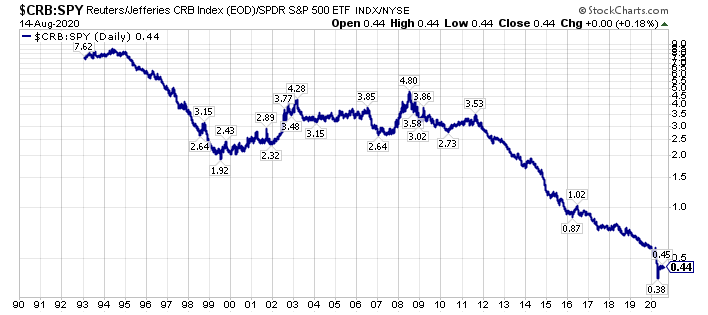 (Source: Author, StockCharts.com)
Going further, the most loathed subsector of the commodity sector is energy, and the most loathed subsector of the energy sector, is natural gas, and natural gas equities, which I call the red-headed stepchild of the energy market. Quietly, though, the leading natural gas producers are putting in very strong returns year-to-date, as supply/demand fundamentals have reached an inflection point.
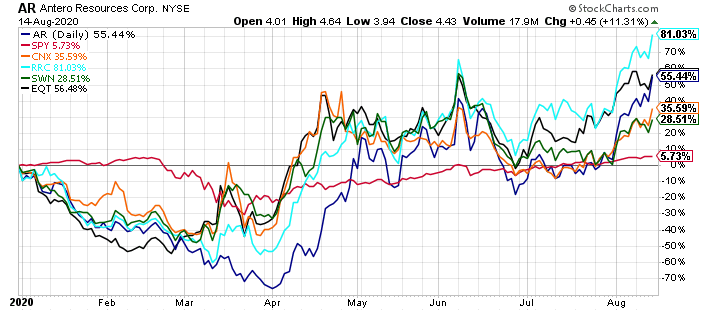 (Source: Author, StockCharts.com)
Range Resources (RRC) shares, which I wrote about in January highlighting the advantages of core Appalachia production, are higher by 81.0% year-to-date, and 92.5% since that article’s publication, EQT Corp. (EQT) shares, which I wrote about in March highlighting the inflection point, are higher by 56.5% YTD, and higher by 80.2% since that article’s publication, and Antero Resources (AR) shares, which I called a generational buy on two occasions already this year, the first publicly in February, are up 55.4% YTD, and 146.1% from that February 19th, 2020 publication date, which was prior to the broader market unwind post-COVID-19.
CNX Resources (CNX) shares are up 35.6% YTD, and Southwestern Energy (SWN) shares are up 28.5%. Thus, all five of these top-10 U.S. dry natural gas producers are materially outperforming their energy peers, and the SPDR S&P 500 Index YTD, leading what I believe is a forthcoming broader commodity equity rally.
Longer-term investors do not need to wade in the far out-of-favor sectors of the commodity complex to get a benefit, in my opinion, as large-cap stocks like BHP Group (BHP), Rio Tinto (RIO), and Exxon Mobil (XOM), which trade at respective price-to-earnings ratios of 15.4, 14.0, and 25.7, offer the diversification benefits, and higher sustainable yields, that many investors should be seeking right now.
 (Source: GMO)
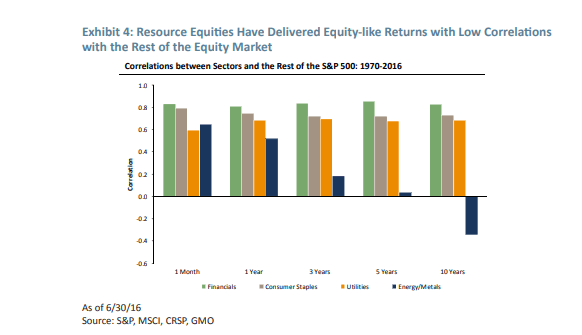
In closing, commodity equities are historically non-correlated to the rest of the S&P 500 Index, which itself has been moving in lockstep with the bond market higher much of the past decade. Thus, with prospective real returns so dismal for traditional asset classes, investors should consider their alternatives, and venture out beyond sectors like REITs, which had outperformed for nearly two decades, but are now faltering.
There is historic opportunity in the investment markets today. I have spent thousands of hours analyzing the markets, looking for the best opportunities, looking to replicate what I have been able to accomplish in the past. From my perspective, the opportunities in targeted out-of-favor equities today are every bit as big as the best opportunities in early 2016, and late 2008/early 2009. For further perspective on these opportunities, consider a membership to The Contrarian, sign up here to join.
Disclosure: I am/we are long AR, BHP, C, CNX, EQT, GOLD, RIO, RRC, SWN, XOM, AND SHORT AAPL, PG, AND SPY IN A LONG/SHORT PORTFOLIO. I wrote this article myself, and it expresses my own opinions. I am not receiving compensation for it (other than from Seeking Alpha). I have no business relationship with any company whose stock is mentioned in this article.
Additional disclosure: Every investor’s situation is different. Positions can change at any time without warning. Please do your own due diligence and consult with your financial advisor, if you have one, before making any investment decisions. The author is not acting in an investment adviser capacity. The author’s opinions expressed herein address only select aspects of potential investment in securities of the companies mentioned and cannot be a substitute for comprehensive investment analysis. The author recommends that potential and existing investors conduct thorough investment research of their own, including a detailed review of the companies’ SEC filings. Any opinions or estimates constitute the author’s best judgment as of the date of publication and are subject to change without notice.